Network Images
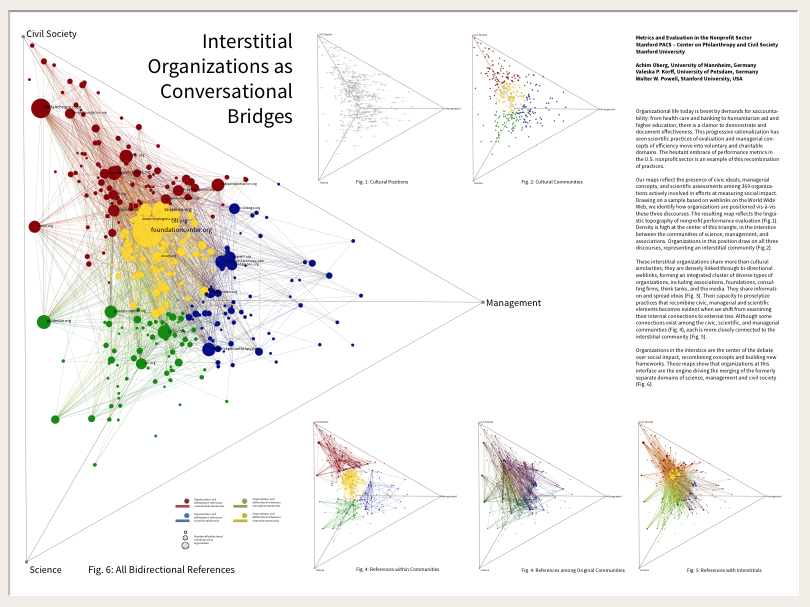
Does every picture tell a story? We often use various network graphics to portray social and economic processes, and to offer snapshots of technological change.
John Padgett’s and my new book, The Emergence of Organizations and Markets, Princeton University Press, 2012, is chock full of network images, here are a few examples:
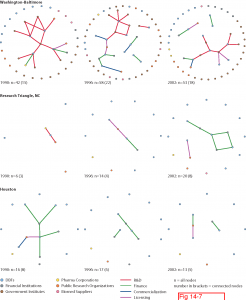
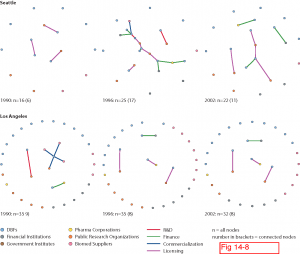
Below are a handful of visualizations from recent papers.
Patent Citation ‘Food Web’: Biogen’s Avonex, from Owen-Smith and Powell, 2006. This graphic portrays the citation network for one of the biotech firm’s leading medicines, capturing three “generations” of prior art.
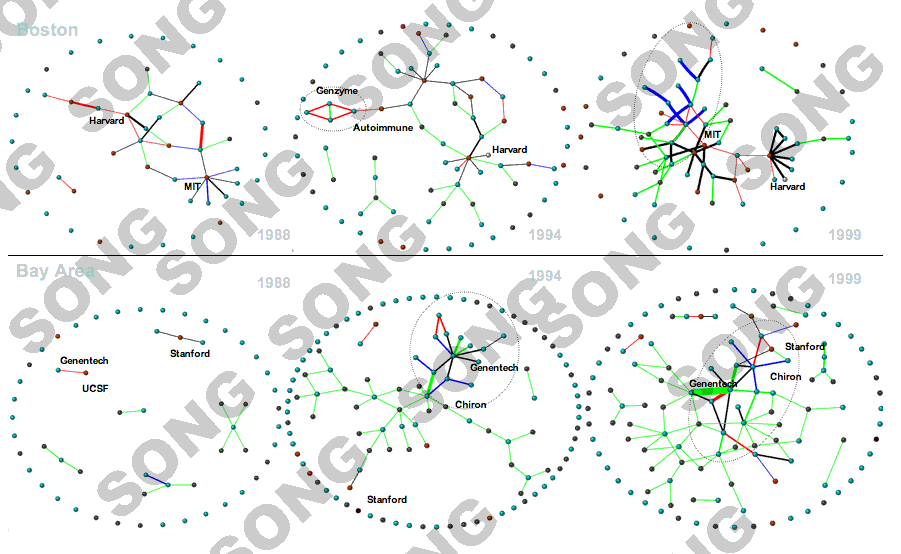
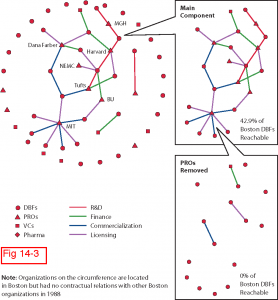
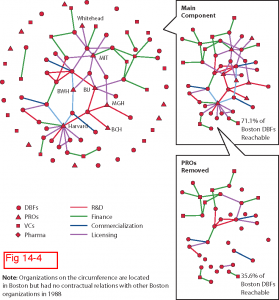
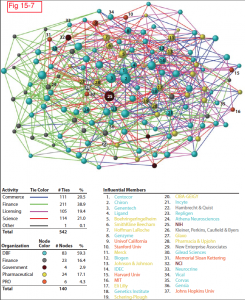
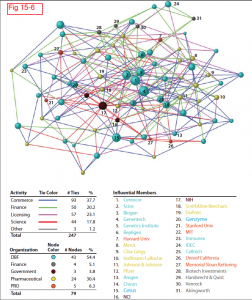
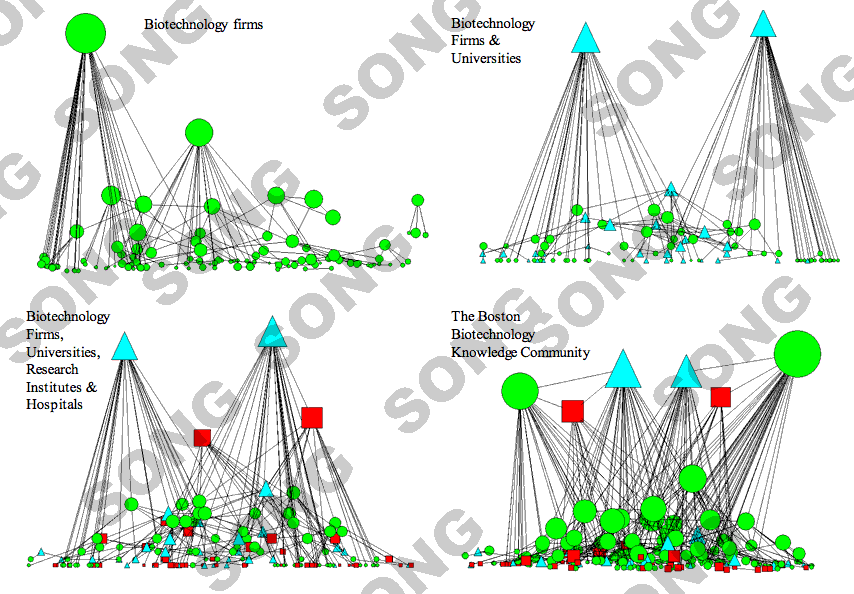
In Boston, organizational diversity drives innovation networks, from Minerva 45 (2007): 121-42. This graphic depicts the web of formal contractual collaborations among Boston-based firms, hospitals, and universities over the period 1988-1999.
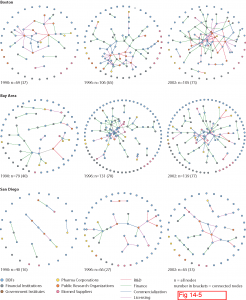
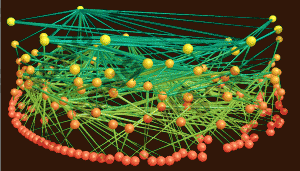
Boston and Bay Area Networks, 1988, 1994, 1999. Collaborations in Boston flow through public research organizations, while collaborations in the Bay Area are mobilized by first-generation, open science companies and venture capitalists.
